Ischemic stroke is among the leading causes of death and disability worldwide. Our work has helped elucidate the hyperacute to acute hemodynamic and metabolic evolution of the infarct and its relationship to spreading depolarizations (SD), and the loss of blood-brain barrier (BBB) integrity. We examine the modulation of ischemic outcomes via physiological and pharmacological interventions including rho-associated kinase (ROCK) inhibition and preemptive prophylaxis via chemical preconditioning. More recently we have helped launch the NIH-sponsored Stroke Preclinical Assessment Network (SPAN). (Ayata) (Publications)
Peri-Infarct Hot-Zones Have Higher Susceptibility to Optogenetic Functional Activation-Induced Spreading Depolarizations

Optogenetic stimulation-induced spreading depolarization (SD) rates and thresholds. Upper and the diagrams show the rate of peri-infarct SD occurrence as percent of trials during 5-min optogenetic stimulations of the 3 regions of interest in middle cerebral artery occlusion (MCAO) and sham groups. Statistical comparisons were made between ipsilesional and contralesional homotopic regions (left) and between homotopic regions in MCAO (left) and sham (right) groups using Fisher exact test. Horizontal dotted line indicates the 5-min rate of spontaneous peri-infarct SD occurrence in the absence of optogenetic stimulation (5.4%) for comparisons with the stimulus-induced SD rates. Lower shows the light intensity threshold when SD was triggered. Trials that failed to trigger an event are plotted as threshold above 10 mW. Statistical comparisons were made between ipsilesional and contralesional homotopic regions (left, MCAO cohort) and between homotopic regions in MCAO (left) and sham (right) groups (Mann-Whitney U test; a and b: P=0.042 and 0.097, respectively, vs ipsilesional core, c and d: P=0.004 and 0.003, respectively, vs ipsilesional peri-infarct, e and f: P=0.015 and 0.036, respectively, vs ipsilesional mild ischemic region of interest). The timelines for the entire dataset are shown in Figure II in the Data Supplement. Learn more.
Supply-demand mismatch transients in susceptible peri-infarct hot zones explain the origin of spreading injury depolarizations
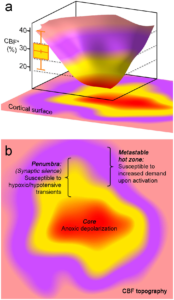
The concept of peri-infarct hot zones susceptible to PID initiation a. Three-dimensional rendering of a hypothetical CBF defect upon focal arterial occlusion, depicting the conceptual framework consisting of the severely ischemic depolarized core (red), the penumbra (yellow), and the metastable hot zone surrounding it (lavender). The narrow critical CBF range defining the hot zone is also shown from Figure 2d (yellow bar, residual CBF in shoulder S1 where a PID is triggered upon shoulder stimulation). b. Two-dimensional projection of the perfusion defect. In the metastable hot zone, increased demand during functional activation of the tissue worsens the supply-demand mismatch to trigger a PID. Because penumbra is electrophysiologically silent, by definition it cannot be activated upon somatosensory stimulation; therefore, it is only susceptible to reduced O2 supply during hypoxic and hypotensive transients to trigger a PID. Learn more.
Migraine Prophylaxis, Ischemic Depolarizations, and Stroke Outcomes in Mice
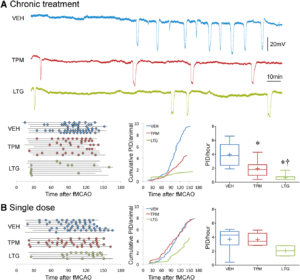
Chronic topiramate and lamotrigine treatment suppresses peri-infarct depolarizations (PIDs). A, Upper panel shows representative electrophysiological tracings of repetitive PIDs that spontaneously arise around focal ischemic tissue during filament middle cerebral artery occlusion (fMCAO) after 7 weeks of daily treatment with vehicle (VEH, blue), topiramate (TPM, red), or lamotrigine (LTG, green) in WT mice. Lower left panel summarizes all experiments. Horizontal lines indicate the time of onset and end of electrophysiological recordings with respect to fMCAO onset in each mouse, and circles indicate PIDs. Line graph shows average cumulative PID occurrence per mouse as a function of time. When calculating the cumulative PID occurrence over time, differences in group sizes and recording durations were taken into account. Whisker-box plots show average overall PID frequency; n=6, 9, and 8 mice in vehicle, topiramate, and lamotrigine groups, respectively. One-way ANOVA followed by Holm–Sidak multiple comparisons test. Treatment effect F(2,23)=18.1, P<0.0001. Post hoc comparisons: *P<0.05 vs VEH; †P<0.05 vs TPM. B, Left panel summarizes all experiments where horizontal lines indicate the time of onset and end of electrophysiological recordings with respect to fMCAO onset in each mouse, and circles indicate PIDs. Line graph shows average cumulative PID occurrence per mouse as a function of time. When calculating the cumulative PID occurrence over time, differences in group sizes and recording durations were taken into account and corrected for. Whisker-box plots show average overall PID frequency; n=7, 5, and 4 mice in vehicle, topiramate, and lamotrigine groups, respectively. One-way ANOVA followed by Holm–Sidak multiple comparisons test. Treatment effects were not statistically significant. Learn more.
Endothelial Dysfunction Abrogates the Efficacy of Normobaric Hyperoxia in Stroke

NBO worsens CBF deficit after dMCAO in eNOS -/- and ApoE -/-. A, Representative speckle contrast images taken just before and 60 min after NBO (15 and 75 min after dMCAO, respectively) in WT, WT on HFD (WT + HFD), ApoE KO on HFD (ApoE KO + HFD), and eNOS KO mice. Superimposed in blue are pixels with residual CBF 25%. NBO reduced the area of perfusion defect in WT, but increased it in ApoE KO+ HFD and in eNOS KO. Imaging field position is shown in D. B, Time course of changes in area of cortex with severe CBF deficit (residual CBF 20%) in normoxic and NBOmice. NBOstabilizedthe area of perfusion defect in WT(green arrows), but abruptly worsened it in eNOS KO andto a lesser extent in ApoE KO + HFD(red arrows). Using aresidual CBF threshold of 30% or 40% yielded similar conclusions (data not shown).Time 0 indicates dMCAO and horizontal barre presents 100% O2 starting 15 min after dMCAO. C, Time course of changes in satHb within an ROI placed within the penumbra. NBO rapidly and significantly increased cortical oxygenation in WT, and to a less erextent in WT + HFD and ApoEKO + HFD groups (greenarrows),but failed to do so in eNOS KO, presumably because ofsignificantly worsening perfusion negated increased O2 delivery(see A and B). D, Mouse skull showing the position of imaging field over the right hemisphere, andthe ROI used to measure CBF changes in mildly ischemic cortex (yellow dot). NBO did not change perfusion in mildly ischemic cortex away from the ischemic core in WT mice ,but abruptly reduced it in eNOSKO (red arrows).*p
0.05 versus normoxia group, two-way ANOVA for repeated measures followed by Fisher’s LSD. Vertical error bars indicateSEM. Sample sizes are shown next to each group in A. Learn more.
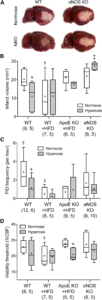
The cerebroprotective effect of NBO is diminished in ApoE KO and abolished in eNOS KO mice. A, Representative topical TTC-stained brains showing the dorsolateral cortical infarct 48 h after 75 min transient dMCAO in WT and eNOS KO. B, NBO significantly reduced infarct volume in the WT, but not in WT HFD or ApoE KO HFD groups. Indeed there was a trend for larger infarct volumes after NBO in eNOS KO. Of note, HFD decreased infarct volumes significantly in WT mice. C, The frequency of PIDs was also reduced by NBO in WT mice only, as well as by HFD in WT and ApoE KO mice. D, Hyperoxia decreased the minimum critical CBF level required to survive 60 min dMCAO, suggesting that enhanced cortical oxygenation was still neuroprotective, but tissue outcome was offset by worsening perfusion in ApoE KOHFD and eNOS KO groups. Data are expressed as box-whisker plots in which median (horizontal line), 25–75% and full ranges(box-whisker), and mean() areshown. *p <0.05 versus normoxia; † p <0.05 versus all other normoxic groups; ‡ p <0.05 versus all other hyperoxic groups; § p <0.05 versus normoxic WT and eNOS KO; two-way ANOVA followed by Fisher’s LSD. Samplesizes are shown under each group. Learn more.
Migraine Mutations Increase Stroke Vulnerability by Facilitating Ischemic Depolarizations
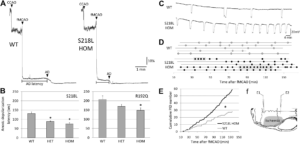
Faster anoxic depolarization (AD) rates and more frequent peri-infarct depolarizations (PIDs) in FHM1 mutant mice. A, Representative laser Doppler tracings show cerebral blood flow (CBF) reduction on common carotid artery occlusion (CCAO) followed by filament occlusion of the middle cerebral artery (fMCAO). A further decline in CBF marks the onset of AD and is due to the vasoconstrictive effect of tissue depolarization on ischemic microvasculature.18 Scale bars: vertical, 10%; horizontal, 1 minute. B, The latency to AD was shorter in S218L and R192Q mutants (P<0.001 and P=0.035, respectively), with a trend for an allele-dosage effect. *P<0.05 vs wild type (WT). C, Representative electrophysiological tracings show more frequent PIDs in S218L homozygous (HOM) vs WT. Scale bars: vertical, 20 mV; horizontal, 4 minutes. D, PIDs (round symbols shown as a function of time) occurred in S218L HOM mice more frequently and sometimes in clusters (rectangular boxes). Horizontal lines indicate the time of onset and end of electrophysiological recordings in each mouse (n=5 each). When the average PID frequency was calculated, these minor differences in recording duration were taken into account. E, Pooled cumulative PID numbers as a function of time after fMCAO was more than doubled in S218L HOM mice (*P<0.001; n=5 each). F, Experimental setup showing 2 intracortical glass micropipettes (E1, E2) placed outside the ischemic territory to detect PIDs after fMCAO. Shaded area indicates typical distribution of CBF deficit after fMCAO. HET indicates heterozygous. Leran more.
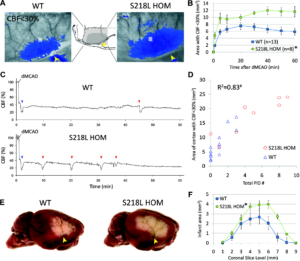
FHM1 mutant mice develop larger areas of cerebral blood flow (CBF) deficit during distal middle cerebral artery occlusion (dMCAO) because of increased susceptibility to ischemic depolarizations. A, Representative laser speckle contrast images show the area of cortex with ≤30% residual CBF vs preischemic baseline (blue pixels) 60 minutes after dMCAO in wild-type (WT) and S218L homozygous (HOM) mice. Similar data were obtained with the R192Q strain (n=6 mutant and 6 WT; data not shown). Imaging was performed over the right hemisphere (light gray–shaded rectangle in the inset) through intact skull. Arrowheads indicate clip occlusion. B, The area of CBF deficit expanded rapidly in S218L HOM throughout the 60-minute dMCAO (*P=0.004). C, Representative tracings show cortical blood flow reductions in penumbra (measured within the gray squares shown in A) after dMCAO. Anoxic depolarization triggers the first peri-infarct depolarization (PID; blue arrowheads), marking a second abrupt reduction in perfusion. Each subsequent PID (red arrow heads) causes a characteristic blood flow transient. D, The frequency of PIDs was higher in S218L HOM and correlated with the area of hypoperfused cortex 60 minutes after dMCAO (#P<0.001). Each symbol represents the PID frequency in individual mice. E, Representative 2,3,5-triphenyltetrazolium chloride–stained whole brains show enlarged infarcts in S218L HOM 48 hours after 60 minutes of dMCAO. F, The area of infarcts in 1-mm-thick coronal slices (0=anterior, 9=posterior) were larger in S218L HOM vs WT (*P=0.016, S218L HOM vs WT for infarct areas). Integrated total infarct volumes were also larger in the mutants (19±3 versus 11±2 mm3, respectively; P=0.008). Leran more.
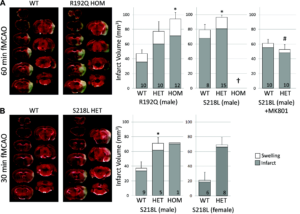
FHM1 mutant mice develop larger infarcts after experimental stroke selectively attenuated by the N-methyl-D-aspartate receptor antagonist MK-801. Left, Representative infarcts (unstained white tissue) 24 hours after filament occlusion of the middle cerebral artery (fMCAO). Right, Infarct and ischemic swelling volumes (gray and white bars, respectively). A, After 60 minutes of fMCAO, infarcts were larger in both R192Q and S218L mutants vs wild type (WT; P=0.007 and P=0.019, respectively). One of 9 WT, 8 of 23 S218L heterozygous (HET), and all 8 S218L homozygous (HOM; †) mice died within 24 hours (the Table) and were excluded from infarct volume analysis. Because genetic backgrounds and infarct volumes differed significantly between WT controls of the 2 mutant strains, we did not directly compare S218L and R192Q mutants in this study. MK-801 (1 mg/kg IP 15 minutes before fMCAO) significantly reduced infarct volume in the S218L HET mutants (P<0.001 vs untreated S218L HET shown in A) but not in the WT (P=0.061 vs untreated WT shown in A). Therefore, MK-801 was more efficacious in FHM1 mutants (P=0.026 for infarct reduction by MK-801 between WT and FHM1 mutants). As a result, after MK-801, infarct and swelling volumes were comparable between WT and S218L HET mice (P=0.367), as were neurological outcomes (the Table). B, Thirty minutes of fMCAO also resulted in larger infarcts in male and female S218L mutants vs WT (P=0.028). Despite shorter ischemia, 3 of 4 S218L HOM mutants died within 24 hours and were again excluded from infarct volume analysis; the data from the only surviving HOM mutant are shown. There was no mortality in the WT and HET groups after 30 minutes of fMCAO. The numbers of mice are shown on each bar. SE bars and P values refer to total volume (ie, infarct plus swelling). *P<0.05 vs WT, #P<0.05 vs untreated S218L HET after 60 minutes of fMCAO. Leran more.