Aneurysmal subarachnoid hemorrhage (SAH) carries high morbidity and mortality. Those who survive the early hours and days after SAH suffer from a delayed form of injury. We investigate the neurovascular mechanisms of acute and delayed brain injury after SAH using optical tools in animal models. Moreover, we study intracranial aneurysm formation, growth and rupture using an elastase injection model. These experimental platforms allow us to explore prophylactic and therapeutic interventions, such as rho-associated kinase (ROCK) inhibition and neuromodulation via noninvasive vagus nerve stimulation (VNS), to improve the outcomes. (Chung, Ayata) (Publications).
Non-invasive vagus nerve stimulation prevents ruptures and improves outcomes in a model of intracranial aneurysm in mice
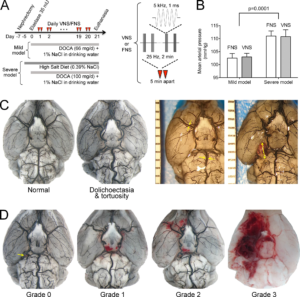
Experimental protocols and morphological endpoints. (A) Experimental timeline shows the timing of aneurysm induction model procedures and VNS or FNS (red triangles). Mild and severe model differences in DOCA dosing and high-salt diet are also shown. Transcutaneous electrical stimulus to achieve VNS or FNS consisted of 1 msec, 5 kHz sine wave pulses delivered at 25 Hz for 2 minutes, repeated once 5 minutes apart. (B) Severe model consistently yielded higher arterial blood pressures than the mild model (p<0.001) without a difference between VNS and FNS groups (two-way ANOVA). (C) Left: Two representative brains showing gross morphological changes in large cerebral arteries. Presence or absence of tortuosity was recorded as a secondary endpoint. Right: Two representative brains showing the method of arterial (left) and aneurysmal (right) diameter measurements as readouts using an on-field millimeter scale. Largest visible diameter of each aneurysm was measured. (D) Representative brains showing typical examples for SAH grades 0–3 used to quantify SAH severity. Details of grading are provided in the methods. Learn more.
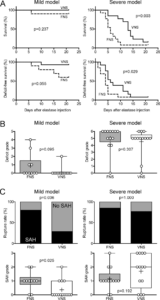
Primary outcomes. (A) Survival (upper row) and deficit-free survival (lower row) curves for FNS and VNS are shown for mild (left) and severe (right) models (n=10 FNS and 14 VNS in the mild model, and 13 each in the severe model; Gehan-Breslow-Wilcoxon test). (B) Neurological deficit grades for mild (left) and severe (right) models. Each data point reflects one animal (Mann-Whitney test). (C) Rupture rates (upper row) and SAH grades (lower row) are shown for mild (left) and severe (right) models. Rupture rates were compared between FNS and VNS using Fisher’s exact test, and SAH grades using Mann-Whitney test. Learn more.
Sex and genetic background effects on the outcome of experimental intracranial aneurysms
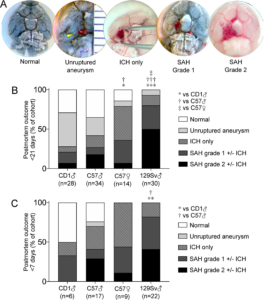
Postmortem examination findings. A) Representative postmortem findings for each of the five outcome categories. Unruptured aneurysm diameter (largest visible) measurement is shown using an on-field millimeter scale. Spontaneous mortality precluded successful intravascular ink perfusion in a subset of animals, such as the brains shown for intracerebral hemorrhage (ICH) only and subarachnoid hemorrhage (SAH) grade 2. B) Summary of postmortem outcomes in the entire cohort followed for up to 21 days (χ2). Pairwise comparisons showed p=0.344 CD1 vs. C57 male, p=0.018 CD1 vs. C57 female, p<0.001 CD1 vs. 129Sv, p=0.045 C57 male vs. female, p<0.001 C57 male vs. 129Sv, and p=0.012 C57 female vs. 129Sv. C) Summary of postmortem outcomes in the subset of animals followed for up to 7 days (χ2). Pairwise comparisons showed p=0.331 CD1 vs. C57 male, p=0.089 CD1 vs. C57 female, p=0.004 CD1 vs. 129Sv, p=0.201 C57 male vs. female, p=0.037 C57 male vs. 129Sv, and p=0.561 C57 female vs. 129Sv. Learn more.
Subarachnoid hemorrhage leads to early and persistent functional connectivity and behavioral changes in mice
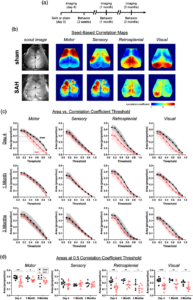
Subarachnoid hemorrhage (SAH) leads to early and late alterations in seed-based functional connectivity. (a) Experimental timeline for SAH injection, imaging, and behavioral assessments. (b) Representative seed-based connectivity maps at day 4 showing correlation coefficients from seeds placed in motor, sensory, retrosplenial, and visual cortex. Only left-sided seeds (black circles) are shown. (c) The areas above a positive seed-based correlation coefficient versus threshold are plotted at day 4, one month, and three months. Areas in proportions, normalized to total imaged brain area. Errors in SD. (d) The proportion of total area over a correlation coefficient of 0.5. Lines indicate the mean. Each data point represents a value from a single animal. *p <0.05, **p < 0.01, ***p < 0.001, ****p < 0.0001 for effects between sham and SAH. Learn more.
Cortical Spreading Depolarizations in a Mouse Model of Subarachnoid Hemorrhage
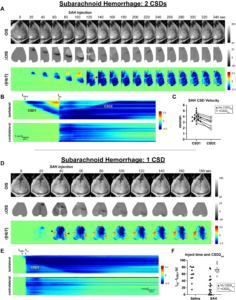
Subarachnoid hemorrhage (SAH) injection can lead to multiple ipsilateral cortical spreading depolarizations (CSDs). a Optical intrinsic signal (OIS), difference in OIS signal with a 10-s moving reference (ΔOIS), and change in total hemoglobin from a pre-CSD reference (r[HbT]) images from a representative mouse in the SAH group that developed two CSDs ipsilateral to the needle insertion site. b Anterior–posterior line of interest versus time using the approach from Fig. 1d. The color scale corresponds to r[HbT]. The first CSD (CSD1) and second CSD (CSD2) on the ipsilatera
side are indicated. The time when CSD1 is first observed (tCSD1) and blood injection time (tinj) are indicated on the plot. c Paired CSD velocities in mice for which there are two CSDs observed ipsilateral to needle insertion (+ CSD2ips, open triangles). Closed triangles indicate CSD velocities in SAH-injected mice with only one ipsilateral CSD. d OIS, ΔOIS, and r[HbT] images from a representative mouse in the SAH group with only one CSD ipsilateral to the needle insertion site. e Anterior–posterior line of interest versus time in an SAH mouse with only one ipsilateral CSD. f A longer interval between the time when CSD1 is observed and blood injection time (tinj − tCSD1) is associated with the occurrence of a second ipsilateral CSD (CSD2ips) for SAH-injected mice but not saline-injected mice. n = 12; second CSD, 8 of 12; survival, 9 of 12. SAH appears on the surface of the brain in the distribution of the middle cerebral artery (arrowheads). Leran more.