Spreading depression/depolarizations (SD) are intense pandepolarization waves slowly propagating in the brain tissue and are believed to mediate the migraine aura perception. Multiple recurrent SDs occur in the setting of ischemic or hemorrhagic brain injury as well. For over two decades, our laboratory has been at the forefront of SD research globally. Using electrophysiological and optical tools, we explore the physiology and pharmacology of SD, its effect on cerebral perfusion and the blood-brain barrier (BBB) and neuroinflammation, and interactions between seizures and SD. Our goal is to better understand the ‘good and bad’ about SD. To this end, we employ a comprehensive array of experimental models and tools to gauge the susceptibility of brain tissue to SD for high-throughput therapeutic screening. (Chung, Harriott, Ayata) (Publications)
Spreading Depression, Spreading Depolarizations, and the Cerebral Vasculature
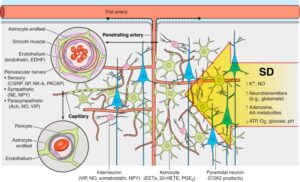
Propagation of SD across the dense cerebral vascular network and the neurovascular unit. SD invading the tissue profoundly impacts all cells and constituents of the cerebrovascular unit. The intense pandepolarization causes massive extracellular ionic, neurotransmitter, and metabolic changes. The cerebrovascular response is the result of numerous complex processes and interactions within the unit, mediated by key cell types and molecular signals, some of which are listed. The large number of mediators and modulators simultaneously released from multiple different cell types has made it extremely difficult to dissect the role of individual factors in the hemodynamic response, further complicated by the heterogeneity of the normal response among studies. Therefore, we have refrained from attempting a contrived representation of the vasomotor actions of each potential mediator or modulator, and instead summarized the available data in Table 1. EDHF, endothelium-derived hyperpolarizing factor; PACAP, pituitary adenylate cyclase activating peptide; NE, norepinephrine; NPY, neuropeptide Y; ACh, acetylcholine; SP, substance P; NK-A, neurokinin A. Learn More.
Determinants of Optogenetic Cortical Spreading Depolarizations
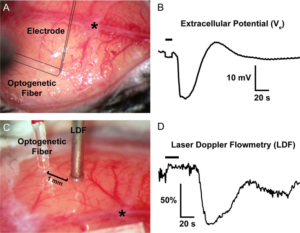
Representative optogenetic SDs through the intact skull. (A,B) The optical fiber, out of focus in this image, is outlined, as is the glass micropipette inserted through a <100-μm burr hole next to the optical fiber to record the extracellular slow potential shifts (Ve) in the right whisker barrel cortex. (C,D) A laser Doppler probe (LDF) away from the optical fiber non-invasively detects the propagating blood flow changes associated with an SD that was optogenetically induced in left visual cortex. SD induction and subsequent propagating blood flow changes are also shown in the Supplemental Video at 20x speed. Horizontal bars on the tracings show illumination period. *, bregma. Learn More.
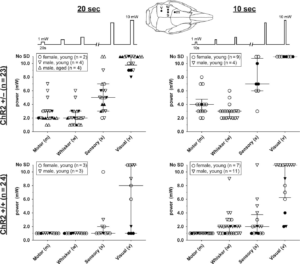
Optogenetic SD thresholds. The threshold light intensities that triggered an SD are shown for ChR2+/− (upper) and ChR2+/+ (lower) mice using 10- (right) or 20-s (left) stimulation paradigms. Each SD threshold determination involved stepwise escalation of light intensity as shown on top. Inset shows stimulation regions. Sample sizes indicate the number of mice. Each animal had multiple SD threshold trials. Each data point represents the threshold in 1 trial. Failure of SD induction despite maximum stimulus is also indicated (No SD). Filled symbols indicate the results of the first SD threshold trial in a hemisphere, whereas open symbols indicate subsequent trials. Median and interquartile ranges are also shown. Young mice were 12–18 weeks and aged mice were ~1 year old. Learn More.
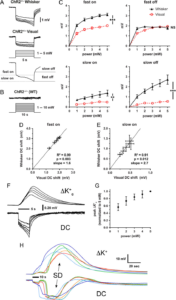
Extracellular potential and [K+]e shifts during optogenetic stimulation. (A) Averaged extracellular potential shifts during light stimulation in whisker barrel and visual cortex at stepwise increasing light intensities (1–5 mW; n = 9 and 10 ChR2+/−, respectively). The electrode tip was located directly under the light stimulation at the center of the light cone. Measurements of fast/slow on and fast/slow off potentials are indicated on a representative trace. (B) Representative extracellular potential recordings during light stimulation in whisker barrel cortex from a ChR2−/− (wild-type) mouse in response to 10-s stepwise increasing light intensities from 1–10 mW. (C) Extracellular potential shift power-response relationship (n = 9 whisker barrel cortex and 10 visual cortex in ChR2+/−). Whisker barrel cortex consistently has significantly greater potential shifts than visual cortex except for the fast off component (***P < 0.0001; **P < 0.01; NS = not significant; 2-way ANOVA). Bars indicate ± standard error of the mean (SEM). (D,E) Slopes of the linear prediction equation represent the ratio of averaged whisker barrel vs. visual cortex fast on (D) and slow on (E) potential shifts at 1.0, 2.0, 3.0, 4.0, and 5.0 mW. Pearson’s r also shown. Bars indicate ± SEM. (F) Optogenetic stimulation enables extracellular potassium measurements at the site of origin of SD. Averaged records showing changes in extracellular potassium-selective electrode (ΔK+) potential shifts and direct current (DC) potential shifts from a 5-s light stimulation (horizontal bar) over whisker barrel cortex (n = 6 ChR2+/− mice). (G) Normalized peak extracellular potassium concentration vs. light stimulation intensity. Bars indicate ± standard deviation. (H) Individual extracellular potassium and concomitant DC potential tracings in response to a 10-s light stimulation (horizontal bar) that precipitates an SD. Colors correspond to specific trials (n = 6 ChR2+/− mice). Learn More.
Spreading depolarizations trigger caveolin-1-dependent endothelial transcytosis
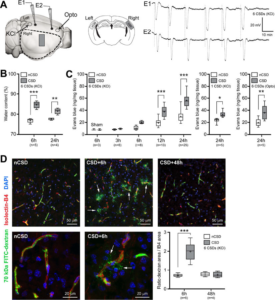
BBB transiently opens after CSD. A) Left panel shows the experimental setup to induce CSDs by either topical KCl (300 mM) application onto occipital cortex via a burr hole, or optogenetic (Opto) stimulation of frontal cortex through intact skull. KCl-induced CSDs were recorded by two glass micropipettes placed serially along the CSD propagation path. Optogenetic CSDs were detected non-invasively by optical intrinsic signal imaging through intact skull. Dashed outline shows cortical tissue harvested for water content and Evans blue extravasation and ROCK mRNA measurements, and the rectangle shows the approximate position at which tissue sections were obtained for fluorescent confocal and electron microscopy studies, also shown in the middle panel on coronal sections in CSD and control (non-CSD, nCSD) cortices. All assessments were carried out in tissue remote from CSD induction and electrophysiological recording sites to avoid direct non-specific effects of trauma and high concentration KCl. Right panel shows representative intracortical microelectrode recordings of 6 CSDs induced approximately every 10 minutes by topical KCl application. B) Parenchymal water content at 6 and 24 hours after 6 CSDs compared with nCSD side. **p<0.01, ***p<0.001, two-way ANOVA (time x hemisphere as factors) followed by Sidak’s post-hoc multiple comparisons test. C) Left panel shows cortical Evans blue extravasation in CSD and nCSD hemispheres 3 to 24 hours after 6 CSDs. Tissue Evans blue levels in sham controls at 6 hours are also shown. ***p<0.001, two-way ANOVA (time x hemisphere as factors) followed by Sidak’s post-hoc multiple comparisons test. Middle panel shows the effect of a single CSD at 24 hours. *p<0.05, paired t-test. Right panel shows cortical Evans blue extravasation in CSD and nCSD hemispheres 24 hours after 6 optogenetic CSDs induced and recorded non-invasively. **p<0.01, paired t-test. D) Histological analysis of 70 kDa FITC-Dextran (green) leakage from isolectin-B4 (IB4)-stained blood vessels (red) at 6 and 48 hours after 6 CSDs induced by KCl. Top and bottom histological panels display low and high magnifications, respectively, of different fields. Arrows point to extravascular 70 kDa FITC-Dextran. Lower right panel shows the ratio of total pixel area of 70 kDa FITC-Dextran to IB4 pixel area indicating vasculature. ***p<0.001, two-way ANOVA (time x hemisphere as factors) followed by Sidak’s post-hoc multiple comparisons. Whisker-box plots show full (whiskers) and interquartile (box) ranges, as well as the median (horizontal line) and mean (+). Learn More.
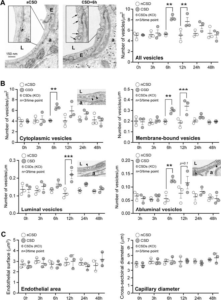
CSD transiently activates endothelial transcytosis. A) Transmission electron microscopic analysis revealed a significant increase in endothelial vesicle number 6 and 12 hours after KCl-induced CSDs. Left panel shows individual vesicles (arrows) on CSD hemisphere. Right panel shows the time course of total endothelial vesicle density. *p<0.05, **p<0.01, ***p<0.001, two-way ANOVA (time x hemisphere as factors) followed by Sidak’s post-hoc multiple comparison test. B) Cytoplasmic, membrane-bound (all), luminal and abluminal endothelial pinocytic vesicle density shown separately following KCl-induced repetitive CSD. *p<0.05, **p<0.01, ***p<0.001, two-way ANOVA (time x hemisphere as factors) followed by Sidak’s post-hoc multiple comparison test. C) Endothelial cell area (i.e. cytoplasm) and capillary diameter (i.e. lumen) following KCl-induced repetitive CSD. p>0.05, two-way ANOVA (time x hemisphere as factors) followed by Sidak’s post-hoc multiple comparisons test. Learn More.
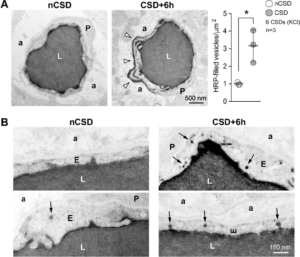
Directional transport of transcytosis from vessel lumen to brain parenchyma. A) Left panel shows transmission electron micrographs from control (nCSD) versus CSD hemispheres illustrating leakage of intraluminal horseradish peroxidase (HRP) into the extravascular space (arrow heads). Right panel shows the density of HRP-filled vesicles within the endothelial cytoplasm 6 hours after repetitive KCl-induced CSDs. *p<0.05, paired t-test. B) High-magnification transmission electron micrographs illustrating increased HRP transcytosis. Arrows indicate single HRP-filled vesicles either budding from the luminal membrane or traveling through the endothelial cytoplasm. All data represent mean ± S.E.M. N=3 animals with 20 replicates in each animal. a, astrocytic endfoot; E, endothelium; L, lumen; nCSD, non-CSD hemisphere. Learn More.

Caveolin-1 is required for CSD-induced BBB disruption. A) Left panel shows low magnification images of cortical 70 kDa FITC-Dextran (green) leakage around blood vessels (red) in WT (upper panels) and absence of it in Cav-1-/- (lower panels) mice 6 hours after KCl-induced CSDs. Right, Quantification of 70 kDa FITC-Dextran extravasation in the cerebral cortex. Whisker-box plots show full (whiskers) and interquartile (box) ranges, as well as the median (horizontal line) and mean (+). ***p<0.001 by one-way ANOVA followed by Turkey’s post-hoc test. B) Higher magnification images to better illustrate the absence of leakage in Cav-1-/- mice (lower panels) compared to WT mice (upper panels) 6 hours after KCl-induced CSDs. DAPI, 4,6-Diamidino-2-phenylindole; IB4, isolectin-B4; nCSD, non-CSD hemisphere. Learn More.
Spreading depression as an innate antiseizure mechanism
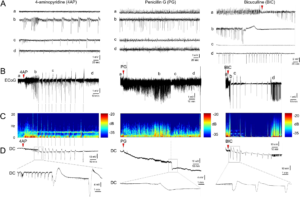
Focal cortical seizures trigger spreading depression. A Representative tracings show typical ECoG phases (a–d) of 4AP, PG, or BIC microseizures, as indicated on the full ECoG timeline (B). Red arrowheads show the time of drug application. Vertical dashed lines indicate SDs. C Time–frequency-power spectra of the full timeline shown in B calculated using Thomson’s multitaper method. D Corresponding DC tracings show one or more SDs triggered during the seizures as large negative slow potential shifts. Boxes indicate expanded views. These were simultaneously confirmed on IOS as SD waves. A total of 11 spontaneous SDs originated from the 4AP window starting 23 min after drug application in this animal. PG seizure triggered 1 SD at 134 min and BIC seizure triggered 10 SDs between 3 and 60 min. Learn More.
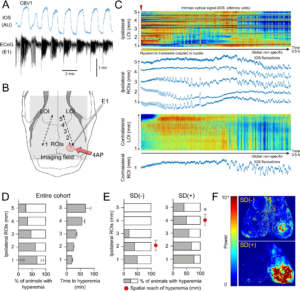
Spatial reach of seizures across the cortex predicts SD occurrence. A Representative 4AP experiment shows hyperemia coupled to seizure bursts (AU, arbitrary unit) used as a surrogate to examine the spatial spread of the seizure. B We placed a line of interest (LOI) extending from the drug application site anteriorly on the ipsilateral hemisphere, and one symmetrically on the contralateral hemisphere (dashed lines). Five ROIs (1–5) were placed along with the ipsilateral LOI at 1 mm intervals and a contralateral ROI was placed symmetrically to ipsilateral ROI 1. C IOS intensity along with the two LOIs and in each ROI are plotted over time. Red indicates an increase and blue decreases in CBV. Hyperemic transients (yellow arrowheads) reached ROI 3 within 25 min after 4AP (red arrowhead) but did not extend to ROI 4 (experiment without SD). Contralateral LOI and ROI did not show hyperemic bursts, indicating a lack of generalization. Non-specific CBV fluctuations (e.g., due to blood pressure), were distinguishable by their global nature and time course. D The proportion of animals that developed hyperemic transients within each ROI and the time of their onset after 4AP application (±SEM). E Hyperemic transients showed a farther spread in animals that eventually developed an SD. Red circles indicate the average distance hyperemic transients reached from the drug application site in each subgroup (*p = 0.012, unpaired t-test; ±SEM). F Representative CBV power maps show a larger area of cortex with the hyperemic transients in the animal that eventually developed an SD (red high and blue low power). Learn More.
Intracranial pressure spikes trigger spreading depolarizations
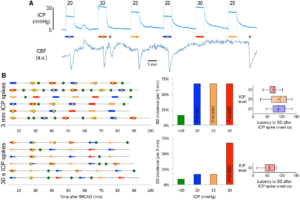
Transient ICP elevations trigger SDs. (A) A representative experiment with six 3-min ICP spikes at 20 (blue), 25 (orange) and 30 (red) mmHg level, as indicated on each transient. Yellow circles indicate SDs triggered during the 3-min ICP spike (horizontal coloured bars), green circles indicate spontaneous SDs occurring outside of the ICP spikes. Lower tracing shows CBF in artificial units used to identify SD occurrence marked by sharp hypoperfusion transients. (B) Summary of SD occurrence rate linked to 3-min (top) or 30-s (bottom) ICP spikes. Timeline on the left shows the temporal relationship between ICP spikes (thick horizontal coloured bars) and SDs either occurring within 3 min after spike onset (yellow symbols) or outside of ICP spikes (i.e. spontaneous SD; green symbols). Each horizontal line is one animal (n = 6/group). ICP-induced SD was defined as an SD occurring within 3 min elevating the ICP (i.e. spike onset). In the bottom timeline, thinner bars show this 3-min period from the 30-s spike onset. Bar graphs in the middle show the 3-min SD incidence during normal ICP (<10 mmHg), and at ICP levels of 20, 25 or 30 mmHg. P < 0.0001 versus normal ICP (χ2). Whisker-bar plots on the right show the latency of ICP-induced SD from the onset of ICP rise. Learn More.
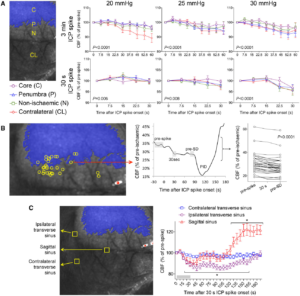
Origins of SDs. (A) Full-field laser speckle imaging of CBF over the dorsal cortex shows the origins of SDs in relation to the perfusion defect (blue overlay). About 1/3 of SDs propagated into the imaging field from the anterior (Ant, green) and a third from the posterior (Post, yellow), while the remainder originated from the peri-infarct regions within the imaging field of view (blue). Horizontal bars below show the distribution of SD origins in persistent ICP and ICP spike groups at different ICP levels. The distribution did not statistically differ among ICP levels or between persistent or transient ICP elevation groups (χ2). (B) Time lapse laser speckle images of relative CBF changes (blue indicates a decrease, red indicates an increase in CBF from baseline image, B) show the origin of a typical SD within the field of view (red circle) and its propagation throughout the peri-infarct cortex in a representative experiment during a 30-s, 30 mmHg ICP spike. The top left image shows the position of the imaging field as in Fig. 5A (a = anterior; p = posterior; i = ipsilateral to fMCAO; c = contralateral; ss = sagittal sinus; red circle, SD origin). Time (in seconds) after ICP spike onset is indicated on the lower left of each frame (B, baseline). SD onset is visible at 75 s marked by a focal hypoperfusion developing near lambda (*), as marked on the upper left frame by a red circle. (C) The latency between ICP spike onset and SD emergence in the field of view differed among SDs originating within the field of view and propagating into the field anteriorly or posteriorly (P = 0.0078; one-way ANOVA). (D) Spatial distribution of the origins of SDs that started within the field of view during steady state ICP (left) and during 30-s, 30 mmHg ICP spikes (right), regardless of ICP level or spike duration. Each yellow circle indicates an SD. The centre of the red cross indicates the average mediolateral and anteroposterior coordinates of SDs in each group with standard errors in mediolateral (vertical error bar) and anteroposterior (horizontal error bar). All SDs originated from the peri-infarct tissue. The mediolateral coordinates of SD origins did not differ between persistent and transient ICP groups (P = 0.49). In contrast, SDs originating during an ICP spike were significantly more posterior compared with persistent ICP group (P = 0.006; Student’s t-test). Indeed, most spike-induced SDs originated from the watershed region among anterior, middle and posterior cerebral arteries (red shaded area). ACA = anterior cerebral artery; PCA = posterior cerebral artery. Learn More.

Mild, transient ICP elevations decrease venous pO2, detected by two-photon pO2 microscopy. (A) Brightfield and phosphorescence images of ischaemic penumbra from a representative experiment demonstrate the typical field of view with pial arteries and veins, and the points of interest used to measure intravascular pO2 in these compartments. Arteries and veins are distinguished by their colour, calibre and tracing the parent vessels. Points of interest 1–2 represent two separate veins, whereas points of interest 13–19 represent an artery. (B) Changes in venous pO2 during a 30 mmHg, 3 min ICP spike (red line) and the SD that was triggered during the spike are shown. Red circle shows the onset of ICP spike. Grey shaded areas indicate the averaged segments to obtain venous pO2 values at baseline and during the ICP spike, where a consistent decrease was found. Venous pO2 during SD was measured at the trough. (C) Cumulative data from all experiments (n = 7 mice, 27 ICP spikes) showing venous pO2 values at baseline, during the ICP spike and SD trough from individual ICP spikes. The wide range of baseline venous pO2 values is due to the spatiotemporal heterogeneity of venous outflow in ischaemic penumbra. With only one exception, all ICP spikes caused a reduction in venous pO2 (paired t-test) suggesting worsening oxygen supply–demand mismatch and increased oxygen extraction fraction, arguing against microvascular shunting or increased capillary transit time heterogeneity. SD occurred only in a subset of experiments as shown, and caused a major drop in venous pO2 (one-way ANOVA for repeated measures using only the ICP spikes that triggered an SD). Learn More.
Non-invasively triggered spreading depolarizations induce a rapid pro-inflammatory response in cerebral cortex
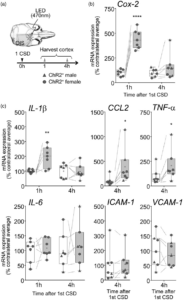
Cortical pro-inflammatory gene expression after a single CSD. (a) CSD was induced by optogenetics (470 nm LED light) and monitored using full-field OIS imaging. Cortical tissue was harvested at indicated times after the first CSD. All markers were studied 1 and/or 4 h after a single CSD. (b and c) Cox-2, IL-1β, CCL2, TNF-α, IL-6, ICAM-1, and VCAM-1 mRNA expression 1 and/or 4 h after CSD, expressed as % of average contralateral expression. Left (white) and right (gray) bars indicate contralateral and ipsilateral hemispheres, respectively (whiskers, full range; box, interquartile range; horizontal line, median; + , mean). Individual data points from each animal are also shown (circles, females; triangles, males). Dashed lines show paired measurements (contralateral vs. ipsilateral) from the same brain. * – **** p < 0.05–0.0001 vs. contralateral hemisphere (two-way ANOVA for repeated measures followed by Holm-Sidak’s multiple comparisons test, or paired t-test). OIS: optical intrinsic signal; CSD: cortical spreading depolarization; Cox-2: Cyclooxygenase-2; IL-1β: interleukin-1β; CCL2: chemokine (C-C motif) ligand 2; TNF-α: tumor necrosis factor-α; IL-6: interleukin-6; ICAM-1: intercellular adhesion molecule-1; VCAM-1: vascular cell adhesion molecule-1.Learn More.
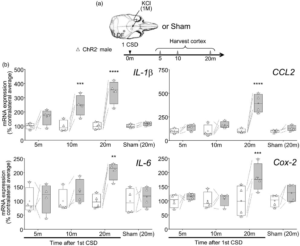
Cortical pro-inflammatory gene expression after a single CSD at ultra-early time points (5, 10 or 20 min after). (a) CSD was induced by brief topical KCl application through thinned skull and monitored by laser Doppler flowmetry in male ChR2− mice. Cortical tissue was harvested at indicated times after the first CSD. Only markers which showed significant change at 1 h after multiple CSD inductions (see Figure 1) were studied. A sham group was also studied at 20 min. (b) IL-1β, CCL2, IL-6, and Cox-2 mRNA expression 5, 10, or 20 min after the first CSD, expressed as % of average contralateral expression. Left (white) and right (gray) at each time point indicate contralateral and ipsilateral hemispheres, respectively (whiskers, full range; box, interquartile range; horizontal line, median; + , mean). Individual data points from each animal are also shown. Dashed lines show paired measurements (contralateral vs. ipsilateral) from the same brain. ** – **** p < 0.01–0.0001 vs. contralateral hemisphere (two-way ANOVA for repeated measures followed by Holm-Sidak’s multiple comparisons test). LDF: laser Doppler flowmetry; CSD: cortical spreading depolarization; Cox-2: Cyclooxygenase-2; IL-1β: interleukin-1β; CCL2: chemokine (C-C motif) ligand 2; IL-6: interleukin-6. Learn More.
Neurovascular coupling during optogenetic functional activation: Local and remote stimulus-response characteristics, and uncoupling by spreading depression
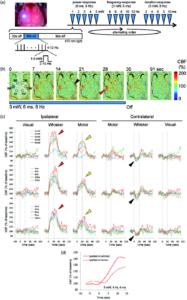
Local and remote regional CBF responses to optogenetic activation of barrel cortex. (a) Experimental setup and protocol: Upper left image shows a typical preparation for optogenetic stimulation and laser speckle CBF imaging through intact skull. The fiberoptic and 470 nm light are shown overlying the whisker barrel cortex. Timeline shows the stimulation protocol where power- (1–5 mW, 6 ms, 8 Hz), frequency- (4–12 Hz, 3 mW, 6 ms) and duration-response (2–10 ms, 3 mW, 8 Hz) trials were delivered in alternating order in different animals to control for any time effect. Each stimulus consisted of 30-s light off (baseline), 30-s light on (train with specific parameters as indicated) and 90-s light off (recovery) periods, during which CBF was continuously imaged using laser speckle. (b) Representative time-lapse laser speckle images showing relative CBF changes (% of baseline) during 3 mW, 6 ms, 8 Hz optogenetic light stimulation (blue bar). The time is shown on upper left of each frame. The outline of skull, and the approximate regions of interest (IM, IW and IV, ipsilateral motor, whisker and visual cortices, CM, CW and CV, contralateral motor, whisker and visual cortices, respectively) within which CBF changes were quantified are also shown. Red arrowhead shows the regional CBF increase within the illuminated barrel cortex. Yellow arrowhead shows the regional CBF increase within the remotely activated ipsilateral motor cortex. Black arrowhead shows the small but highly consistent CBF reduction observed in the contralateral whisker barrel cortex. (c) Time course of CBF changes within the six regions of interest for escalating pulse power (1–5 mW, 6 ms, 8 Hz; upper row), pulse frequency (4–12 Hz, 3 mW, 6 ms; middle row) and pulse duration (2–10 ms, 3 mW, 8 Hz; lower row) trials. Dashed lines indicate light on and off. Arrowheads indicate flow changes as shown in (b). Each tracing is an average of n = 8 mice. Error bars were omitted for clarity. (d) CBF changes at the onset of stimulation show that the hyperemia in stimulated whisker barrel cortex started ∼5 s before ipsilateral motor cortex. Learn More.
Optical coherence tomography of arteriolar diameter and capillary perfusion during spreading depolarizations
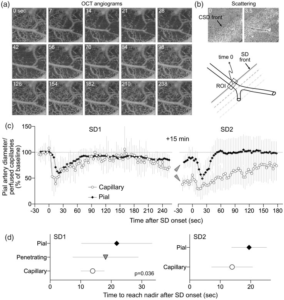
SD-induced changes in capillary perfusion and arteriolar diameter. (a) Time lapse OCT angiograms showing SD propagation across the field of view (right to left). Time is indicated on upper left (sec). (b) Scattering changes associated with SD were used to identify the wave front. Time when the wave front reached the ROI is taken as time 0 to temporally co-register all ROIs (a pial arteriolar ROI is shown as an example). (c) Perfusion signal changes over time expressed as percent of baseline during two consecutive SDs 15 minutes apart. Note that capillary response was calculated using the number of pixels with perfused capillaries, whereas arteriolar response was calculated using average OCT signal intensity within the ROI, precluding comparison of the magnitude and slope of the response among these segments. Arrowheads point to the difference between pial arterial and capillary post-SD oligemia. (d) Because averaging individual time courses from each ROI obscured the timing of responses individually, we measured the time to reach nadir during SD for each ROI in each animal. The time to reach nadir significantly differed among the vascular segments with a progression from capillary to penetrating followed by pial arteries (one-way ANOVA). Penetrating arterioles were not easily identified during the second SD and therefore not analyzed. Data are mean ± standard deviation. Learn More.