Migraine is a complex neurovascular disease affecting almost a third of the entire world population and resulting in significant disability. We have been among the leading laboratories in preclinical research into migraine pathophysiology and therapy. A wide range of experimental models and tools help us examine spreading depression (SD) susceptibility and SD-induced cephalalgic allodynia, and their genetic, hormonal, physiological, and pharmacological modulation. Our ultimate goal is to bring novel prophylactic and therapeutic targets to clinical testing. Migraine shows a strong clinical association with ischemic stroke. Our work has helped elucidate the mechanisms of migraine-stroke association, implicating microemboli and enhanced tissue susceptibility to ischemic injury in migraineurs. We are currently exploring ways to mitigate the risk. (Harriott, Ayata) (Publications)
Optogenetic spreading depression elicits trigeminal pain and anxiety behavior
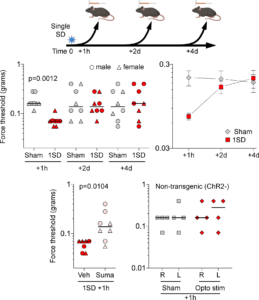
Single SD produces acute periorbital mechanical allodynia. Experimental timeline is shown on top. Left top panel shows individual log force data (grams) from females (triangle) and males (circles) along with the median. A single SD (1SD) reduced periorbital mechanical thresholds 1 hour after SD as compared with sham controls. This effect was lost 2 and 4 days after SD (two-way ANOVA on ranks). Right top panel shows group averages of the same dataset to illustrate the time course of periorbital allodynia (mean ± SEM). Left bottom panel shows normalization of the reduced mechanical thresholds 1 hour after a single SD by sumatriptan (600 μg/kg, intraperitoneal immediately after SD) compared with vehicle (Mann-Whitney U test). Right bottom panel shows single 10 sec, 7mW 470nM optogenetic light stimulation in wild type mice did not produce periorbital mechanical allodynia (Mann-Whitney U test p=0.7714). Learn more.
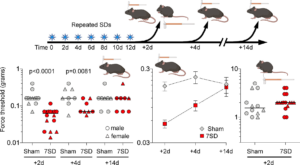
Repeated SDs induce lasting periorbital mechanical allodynia. Left panel shows individual log force data (grams) from females (triangle) and males (circles) along with the median. Seven SDs once every other day (7SD) reduced periorbital mechanical thresholds 2 and 4 but not 14 days after the last SD compared with sham controls (two-way ANOVA on ranks). Middle panel shows group averages of the same dataset to better illustrate the time course of periorbital allodynia (mean ± SEM). Right panel shows unchanged mechanical hindpaw thresholds in repeated SD and sham groups tested 2 days following the last SD (Mann-Whitney U test). Learn more.
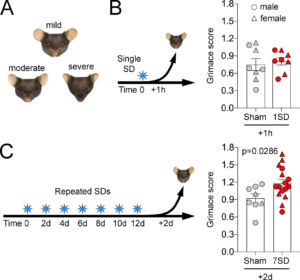
SD induced facial grimace. (A) Facial features of animals with mild, moderate and severe discomfort are illustrated. (B) Single SD (1SD) produced no change in mean mouse grimace score as compared to sham animals when assessed 1 hour later. (C) Repeated SDs (7SD) increased mean mouse grimace score. Individual data points from females (triangle) and males (circles) as well as mean ± SEM are shown (t-test) Learn more.
Anti-migraine Calcitonin Gene–Related Peptide Receptor Antagonists Worsen Cerebral Ischemic Outcome in Mice
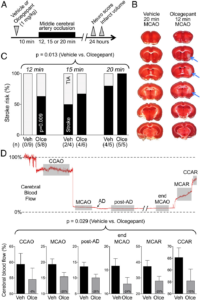
Olcegepant worsens the cerebral blood flow deficit and outcome of 12-, 15-, or 20-minute focal cerebral ischemia. (A) Experimental timeline. (B) 2,3,5-Triphenyltetrazolium chloride–stained coronal brain sections showing the infarct (blue arrows) after 12-minute middle cerebral artery occlusion (MCAO) after pretreatment with a single dose of olcegepant (1mg/kg), and normal brain 20-minute MCAO with vehicle injection. (C) Stroke risk (%) in vehicle (Veh) and olcegepant (Olce) groups after 12-, 15-, and 20-minute MCAO. Data represent the percentage of infarct absence (transient ischemic attack [TIA], gray portion) or presence (stroke, black portion). Actual numbers of stroke/total are also provided in parentheses under the bars. Data were analyzed using multiple logistic regression (independent variables: treatment, ischemia duration; dependent variable: infarct presence) for the entire cohort, as well as using Fisher exact test in the 12-minute MCAO group. (D) Representative cerebral blood flow tracing during MCAO and reperfusion measured by laser Doppler flowmetry. Gray shades represent typical time segments used to quantify the CBF during ischemia and after reperfusion. Lower panel shows the residual CBF (% of baseline) during different stages of MCAO in vehicle (n = 18) and olcegepant (1mg/kg, n = 19) arms (p = 0.029, 2-way repeated measures analysis of variance). Data are from pooled 12-, 15-, and 20-minute MCAO experiments. Numbers within the gray bars represent the relative difference between treatment arms calculated as (CBFOlce/CBFVeh) − 1. AD = anoxic depolarization; CCAO = common carotid artery occlusion; CCAR = common carotid artery reperfusion; MCAR = middle cerebral artery reperfusion. Seven mice in the vehicle arm and 1 mouse in the olcegepant arm were excluded from analyses based on predetermined criteria (see Materials and Methods). There was no mortality. Learn more.
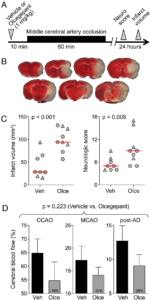
Olcegepant worsens the outcomes after 60-minute focal cerebral ischemia. (A) Experimental timeline. (B) 2,3,5-Triphenyltetrazolium chloride–stained coronal brain sections showing a typical infarct (unstained tissue) after 60-minute middle cerebral artery occlusion (MCAO). (C) Infarct volume (mm3) and neurologic deficit score (p = 0.001 and p = 0.011, respectively, 2-way analysis of variance [ANOVA]). Data from individual animals are shown (triangles = male; circles = female) along with their group median (red lines). Mean ages were 5.3 ± 1.4 and 5.7 ± 1.5 months in the vehicle (Veh) and olcegepant (Olce; 1mg/kg) groups, respectively (all wild type; mean ± standard deviation). (D) Residual cerebral blood flow (CBF; % of baseline) during MCAO (p = 0.223, 2-way repeated measures ANOVA). Numbers within the gray bars represent the relative difference between treatment arms calculated as (CBFOlce/CBFVeh) − 1. Two mice in the vehicle arm and 1 mouse in the olcegepant arm were excluded from analyses based on predetermined criteria (see Materials and Methods). There was no mortality. Learn more.
Vagus nerve stimulation inhibits cortical spreading depression exclusively via central mechanisms
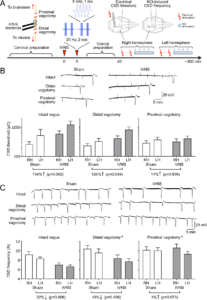
Proximal, but not distal, vagotomy abrogates VNS efficacy on CSD. A) Experimental timeline. Cervical preparation involved surgical exposure of the right vagus nerve and either distal or proximal vagotomy. Two 2-minute iVNS trains (1 ms, 5 kHz sine
wave repeated at 25 Hz) were delivered 5 minutes apart (arrowhead). After the cranial preparation (burr holes, electrode placement, ~40 minutes), electrical CSD threshold and frequency of topical KCl-induced CSDs were determined first in the right (i.e. ipsilateral to iVNS) and then in the left hemisphere. B) Tracings show electrical CSD threshold determination in representative intact, distal or proximal vagotomy rats. Stimulus artefacts indicate the electrical charge application approximately every 5 minutes, and slow negative potential shifts indicate CSDs triggered at threshold intensities. iVNS elevated the electrical CSD threshold by more than 2-fold in intact vagus or distal vagotomy groups but had no effect after proximal vagotomy. C) Representative tracings show topical KCl-induced recurrent CSDs for 1 hour in representative intact, distal or proximal vagotomy rats. iVNS reduced CSD frequency in intact vagus and distal vagotomy groups only. Vagotomy, either distal or proximal, increased KCl-induced CSD frequency. Data are mean±SE. n=12/group. *p < 0.05 vs. sham; †p < 0.05 vs. intact vagus (general linear mixed model with vagotomy, stimulation and hemisphere as independent variables). RH: Right Hemisphere, LH: Left Hemisphere. Learn more.
Headache after ischemic stroke: A systematic review and meta-analysis
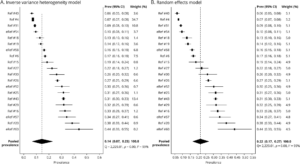
Pooled prevalence of ischemic stroke headache. (A) Inverse variance heterogeneity model: forest plot shows prevalence by individual study and the % weight, which is inversely proportional to the squared value of the standard error. The pooled prevalence of ischemic stroke–related headache is 14%. (B) Random effects model: pooled prevalence of ischemic stroke headache using the random effects model yields a higher pooled estimate (22%). Because of the high degree of heterogeneity, the random effects model tends to unweight the studies, as demonstrated by the % weight values falling between a narrow range of 4.5–5.2. CI = confidence interval. Learn more.
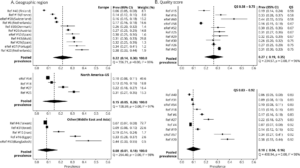
Study characteristics: geographic region and quality score (QS). (A) Headache prevalence varies depending on regional location. European studies had higher prevalence values as compared to studies from other regions (Middle East and Asia). Likewise, studies whose source population was from the United States had higher prevalence values than those from Middle East and Asia. (B) Studies with a lower QS report a higher headache prevalence as compared to studies with higher QS (QS − fractional QS). CI = confidence interval. Learn more.
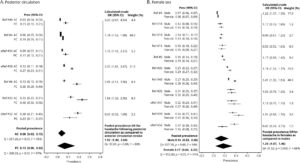
Patient characteristics: posterior circulation (PC) stroke and female sex are associated with greater odds of ischemic stroke headache. (A) Headache prevalence for PC and anterior circulation (AC) stroke is reported for each study. The pooled headache prevalence for PC stroke is higher than that for AC stroke. The odds of having headache is 2-fold higher with PC stroke as compared with AC stroke. (B) Headache prevalence for female and male participants is reported for each study. There is a modestly higher prevalence of stroke-related headache in women as compared to men with a pooled odds ratio (OR) of 1.25. CI = confidence interval. Learn more.