Intracerebral hemorrhage (ICH) is a major cause of death and disability worldwide without effective treatment. Our focus is on the mechanisms and modulators of hyperacute ICH growth, its relationship with spreading depolarizations (SD), and the loss of blood-brain barrier (BBB) integrity after ICH. We study the efficacy and safety of physiological and pharmacological interventions such as procoagulants and rho-associated kinase (ROCK) inhibitors using homologous blood or collagenase injection models, and a range of readouts including MRI, histology, and a battery of neurocognitive tests. (Cenk Ayata) Publications
Rapid hematoma growth triggers spreading depolarizations in experimental intracortical hemorrhage
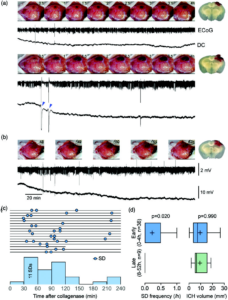
Spreading depolarizations occur during early but not late stages of intracortical hemorrhage. (a) Representative intrinsic optical signal (IOS) images (every 30 min), continuous electrophysiological recordings (ECoG and DC), and the coronal section at the end of the experiment from two animals in the early stage of intracerebral hemorrhage (ICH) (0–4 h). The first animal (top) has a slow growing, small hematoma, and did not develop any spreading depolarization (SD). The second animal (bottom) developed a large hematoma within 90 min. Two SDs occurred during this rapid growth phase (arrowheads). (b) Representative data from an animal studied at a later stage (48–52 h) of ICH. Despite the large hematoma, there was no change in hematoma size and no SD. (c) Time of SD occurrence during early stage of ICH in animals that developed at least one SD. Each line represents one animal and each circle represents one SD. Most SDs emerged between 30 and 120 min after collagenase injection. Animals with no SD are not shown. (d) SD frequency and ICH volume are shown for early and late stages. There was no SD detected during late stages of ICH (p¼0.020 vs. early stage; Mann–Whitney test) despite nearly identical hematoma volumes (p¼0.99 vs. early stage; Mann–Whitney test). Learn more.
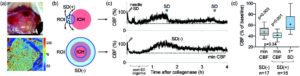
Cerebral blood flow and spreading depolarization occurrence. (a) Representative cortical hemorrhage in the right hemisphere (top) and simultaneous laser speckle flowmetry (LSF) showing relative cerebral blood flow (CBF) imaged through intact skull (bottom). CBF within the ICH is mildly reduced, while rest of the cortex shows normal CBF. (b) Region of interest (ROI, blue shaded) placement at the hemorrhage site is shown for CBF calculation. In animals that developed a spreading depolarization (SD) (top), a circular ROI (0.8 mm diameter) was placed where SD originated from to plot CBF changes in that ROI throughout the 4-h experiment. In animals that did not develop any SD (bottom), a ring ROI (0.8 mm-thick) was placed at the average distance of all SD origins to the center of ICH to capture the CBF in an equivalent perimeter of ICH. (c) Representative CBF tracings are shown from such ROIs in animals with or without SD (bottom and top, respectively). In both cases, CBF decreased to approximately 50% of baseline after the initial SD caused by needle insertion for collagenase injection (0 min), which is typical for post-SD oligemia in mice. An SD (top tracing, blue circle) emerged 100 min after collagenase when CBF was approximately 90% of baseline at its origin. A second SD occurred later around 210 min. The minimum CBF in each tracing is marked by a dotted line. (d) Minimum CBF in experiments that did not show an SD and minimum CBF as well as CBF at the onset of first spontaneous SD in animals that developed one are shown. Average CBF when and where SD originated was above 60% of baseline and significantly higher than the minimum CBF levels reached in either group (p<0.001 and p ¼ 0.003 vs. 1st SD; one-way ANOVA followed by Tukey’s multiple comparisons test). Learn more.
Secondary bleeding during acute experimental intracerebral hemorrhage
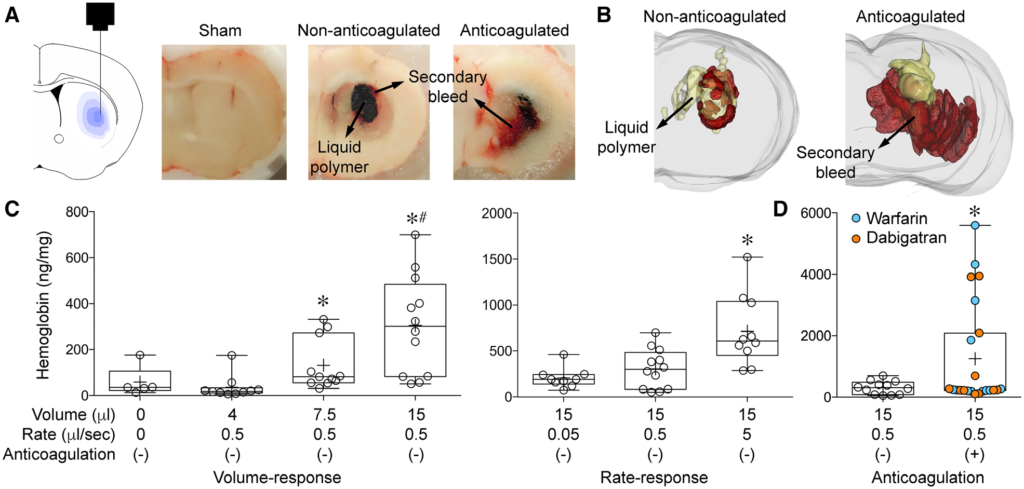
Secondary bleeding during acute experimental intracerebral hemorrhage: Secondary hemorrhage after intrastriatal liquid polymer injection. (A) Graphic representation of polymer injection into the right striatum (left panel) and gross coronal section cut surface showing the black solidified polymer (15 μl) surrounded by secondary bleeding in a non-anticoagulated and an anticoagulated animal. Sham (i.e. needle insertion only) did not cause detectable secondary hemorrhage. Sections were used for three-dimensional reconstruction (Figure 1B; Supplemental Movie 1). (B) Three-dimensional reconstruction of serial coronal sections through the polymer in representative non-anticoagulated (left panel) and anticoagulated (right panel) animals (polymer in yellow, blood in red; see Supplemental Movie 1). Extension of polymer into the ventricle is evident, just as primary ICH often does. (C) Increasing volumes of polymer injection (4, 7.5 or 15 μl) at a fixed rate of 0.5 μl/sec caused progressively larger volumes of secondary hemorrhage that appeared to be bimodal, as measured by hemoglobin ELISA (p=0.0001; Kruskal-Wallis non-parametric one-way ANOVA followed by Dunn’s multiple comparisons test; *p<0.05 vs. 4 μl; #p<0.05 vs. sham). Increasing speeds of polymer injection (0.05, 0.5, 5 μl/sec) caused progressively larger volumes of secondary hemorrhage that once again appeared to be bimodal, as measured by hemoglobin ELISA (p=0.0011; Kruskal-Wallis non-parametric one-way ANOVA followed by Dunn’s multiple comparisons test; *p<0.05 vs. other injection rates). (D) Warfarin or dabigatran anticoagulation significantly increased secondary hemorrhage compared with non-anticoagulated animals. The bimodal distribution appeared to be accentuated by anticoagulation; approximately one third of the anticoagulated cohort had hemorrhage levels that were 15-fold higher than the rest (*p=0.0326; χ2 for hemoglobin >700 or <700 ng/mg). Learn more.