Cerebral small vessel disease (SVD) is arguably the most common neurovascular condition affecting brain health globally. Our interest in SVD is centered around monogenic forms such as cerebral autosomal dominant arteriopathy, subcortical infarcts, and leukoencephalopathy (CADASIL). Employing transgenic mouse models, optical imaging and electrophysiological tools, ischemia modeling, and experimental interrogation of cerebrovascular physiological responses, we explore how human CADASIL mutations affect the vascular and neuroglial function and seek therapies. (Ayata)
CADASIL mutations sensitize the brain to ischemia via spreading depolarizations and abnormal extracellular potassium homeostasis
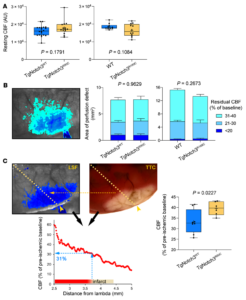
Distal middle cerebral artery occlusion in TgNotch3R90C and TgNotch3R169C cohorts. (A) Resting CBF calculated using laser speckle contrast inverse correlation time values before distal middle cerebral artery occlusion (dMCAO) did not differ between CADASIL mutant mice and controls. Sample sizes are provided in Table 4. Student’s t test. (B) A representative laser speckle contrast image taken 60 minutes after dMCAO shows regions with severe (residual CBF <20%), moderate (21%–30%), and mild (31%–40%) CBF deficit. Composite bar graphs show the areas of severe, moderate, and mild CBF deficit in TgNotch3R90C and TgNotch3R169C mice and their respective controls (TgNotch3WT and WT) 60 minutes after dMCAO (all ages pooled). Two-way ANOVA for repeated measures. P values on each panel are those of main ANOVA. CBF deficit area is shown as mean ± SEM. (C) A representative laser speckle contrast image showing the perfusion defect during dMCAO (left) and 2,3,5-triphenyltetrazolium chloride–stained (TTC-stained) brain showing the infarct in the same brain 48 hours later (right). Images were spatially coregistered using surface landmarks. A line profile was drawn between lambda and the clip occluding the middle cerebral artery (yellow arrowhead). For each animal, CBF was plotted along the line profile as a function of distance from lambda using laser speckle images (bottom). The CBF at the infarct edge was determined (blue dotted lines), representing the CBF threshold for viability, below which tissue infarcted in each mouse. The average viability threshold was significantly higher in TgNotch3R90C vs. TgNotch3WT mice (all ages pooled). Unpaired t test. Learn more.
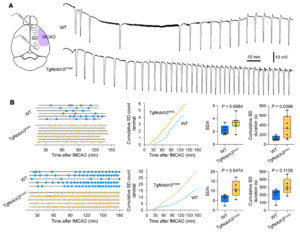
Peri-infarct spreading depolarization during filament middle cerebral artery occlusion in Notch3R90C and Notch3R169C cohorts. (A) Representative extracellular DC potential recordings from peri-infarct cortex showing higher frequency of peri-infarct spreading depolarizations (SDs) in TgNotch3R169C mice compared with WT mice after filament middle cerebral artery occlusion (fMCAO). Experimental setup shows intracortical glass micropipettes placed outside the ischemic core (purple area) to detect SDs. (B) Left: Experimental timelines showing the time of onset and end of recordings in each mouse, and time of occurrence of SDs (round symbols) in WT and TgNotch3R90C or TgNotch3R169C mice. Middle: Pooled cumulative SD numbers per animal over time after fMCAO. Right: The frequency of SDs and cumulative SD duration in WT and TgNotch3R90C mice or TgNotch3R169C mice. Unpaired t test. Sample sizes are provided in Table 4. Learn more.
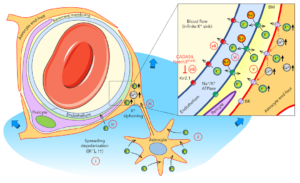
Proposed gliovascular mechanism of extracellular K+ regulation when local buffering mechanisms are exceeded during spreading depolarizations. (i) Upon intense depolarization states, such as anoxic or spreading depolarization, extracellular K+ concentration ([K+]e) can rise above the 10–12 mM ceiling. (b) Astrocytes play a major role in regulating [K+]e via rapid uptake and spatial buffering through the astrocytic syncytium. (c) Astrocytes send their end feet, almost completely encasing the cerebral vasculature, including the capillary bed, providing a route for gliovascular K+ siphoning. (d) The massive rise in [K+]e during an SD might also facilitate direct entry of K+ into the perivascular space to reach the capillary endothelium. (e) Astrocyte end feet have high K+ conductance, in part, due to BK channels activated by intracellular Ca2+ elevations, such as those observed during SD, and release large amounts of K+ into the tight perivascular space. (f) This perivascular K+ is then taken up by the endothelial Na+/K+-ATPase, which is densely — and asymmetrically — localized on the abluminal membranes. (g) Endothelial cells then release the K+ into the blood stream via channels and/or pumps on the luminal membrane, including Kir2.1, which is known to be activated by elevated perivascular [K+]e. (h) Notch3R169C mutation is associated with impaired endothelial Kir2.1 channel function, linking CADASIL to impaired vascular K+ clearance. Learn more.
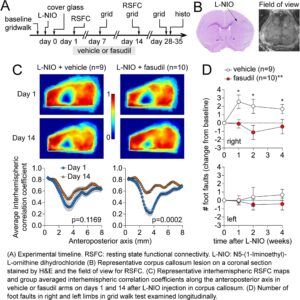
Focal Subcortical White Matter Lesions Disrupt Resting State Cortical Interhemispheric Functional Connectivity in Mice
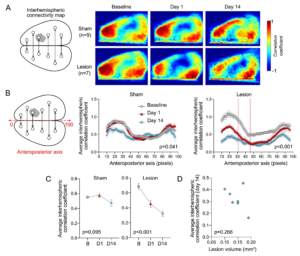
Interhemispheric resting state homotopic connectivity. (A) Left: Diagram showing interhemispheric homotopic connectivity analysis using mirror pixels. Gray shade represents the approximate position of the lesion. Right: Average interhemispheric homotopic connectivity maps generated at baseline and on days 1 and 14 after L-NIO injection. (B) Interhemispheric homotopic correlation coefficients between mirror pixels were averaged across the mediolateral axis (i.e., for each pixel column) and plotted along the anteroposterior axis. All data are Fisher z-transformed. Two-way ANOVA for repeated measures. (C) The average global interhemispheric homotopic correlation coefficient decreased significantly in all animals with a corpus callosum lesion but not in sham controls; the small decline on day 14 was mainly due to partial skull opacification after repeated imaging. All data are Fisher z-transformed. One-way ANOVA for repeated measures. (D) Lesion volumes did not show a consistent relationship to the average global interhemispheric homotopic correlation coefficients in each animal. Correlation coefficients were Fisher z-transformed. Pearson r. Learn more.
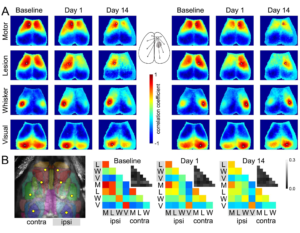
Seed-based connectivity maps. (A) Average RSFC maps generated at baseline and 24 h after L-NIO injection using 4 seeds on each hemisphere as indicated (white dots). The method to calculate the average correlation coefficient between each pixel and all other pixels is shown for a representative seed in the middle inset. (B) Averaged connectivity matrices among the 8 seeds. The absolute value of the standard error of the correlation coefficients for each pair in the matrix is shown in the upper right of each panel in grayscale. Color and grayscale bars are for the connectivity matrix and standard errors, respectively. The sham group is shown in Supplementary Figure 1. Learn more.